This article explains how to debug common problems with THOR scans in ASGARD, including how to identify errors using the debugging tools provided in our products.
General approach
Logs are a good entry point get to the bottom of the problem. Two application logs are available for this, the Agent Log and the THOR Log. We can also review the operating system logs.
Retrieving the Agent Log
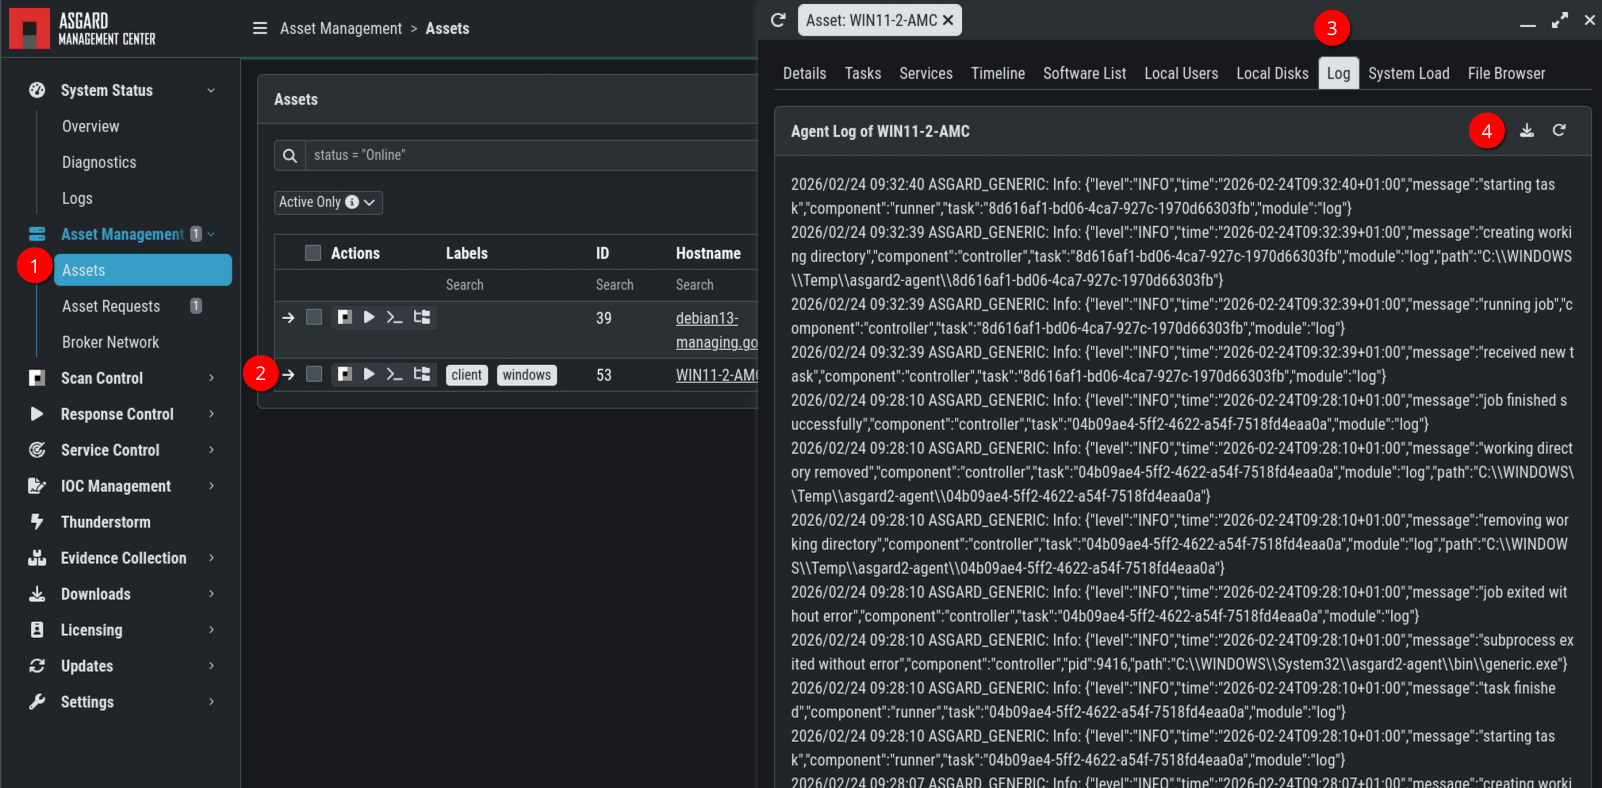
If the Agent service is running on the endpoint, you can access and download the Agent log directly from the Management Center Dashboard by opening the asset's details view (1, 2), selecting the Log tab (3), and clicking the download button (4).
Analyzing the Agent Log
Typically, a faulty scan output appears like this in the agent log:
2025/01/17 18:20:46 ASGARD_GENERIC: Info: {"level":"WARN","time":"2025-01-17T18:20:46+01:00","message":"subprocess exited with error","component":"runner","pid":804,"path":"C:\\Windows\\Temp\\asgard2-agent\\98d518b0-9f57-4e41-a53e-8d3aad506a5a\\thor\\thor64.exe","error":"exit status 1"}
2025/01/17 18:20:46 ASGARD_GENERIC: Info: {"level":"INFO","time":"2025-01-17T18:20:46+01:00","message":"THOR terminated with error: exit status 1","component":"runner"}
2025/01/17 18:20:46 ASGARD_GENERIC: Info: {"level":"ERROR","time":"2025-01-17T18:20:46+01:00","message":"could not run THOR: error: exit status 1 stdout: \"osoft® Windows® ORIGINAL_NAME_1: CONHOST.EXE.MUI INTERNAL_NAME_1: ConHost IMPHASH_1: 0f64302d3280de299f4c51a78746f606\\nInfo Process info PID: 5100
[rest of the event]
Information we can draw from this log extract:
-
The Agent subprocess thor.exe exited suddenly (this can be a hint of EDR activity).
-
The agent registered that THOR terminated.
-
The agent is still running.
-
The last THOR scan log entry begins at "stdout". This indicates the THOR module and scan target active at the time of abortion. The scan target is particularly relevant because loading certain objects into memory for analysis can trigger EDR detection, causing the scan to terminate.
Downloading the latest THOR Log
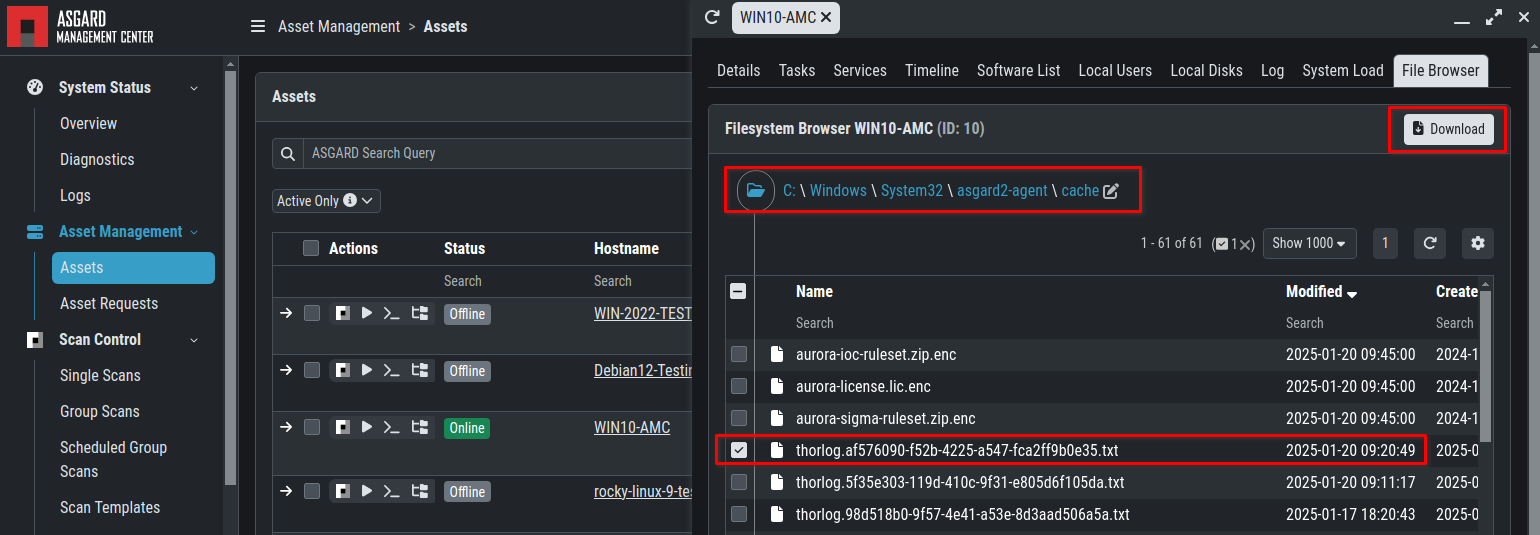
You can obtain THOR logs for an endpoint in several ways. Typically, the Management Center stores them and you can retrieve them via the dashboard. The latest log also resides on the endpoint in the binary folder asgard2-agent/cache.
The agent deletes old THOR logs in the cache folder when a new scan starts to minimize THOR's space usage on the endpoint.
If a scan ends prematurely, the log may not transfer to the Management Center. In that case, retrieve the log from the endpoint via Filesystem Browser.
Analyzing the THOR Log
To analyze the log, download the file because the dashboard's Filesystem Browser shows only a preview.
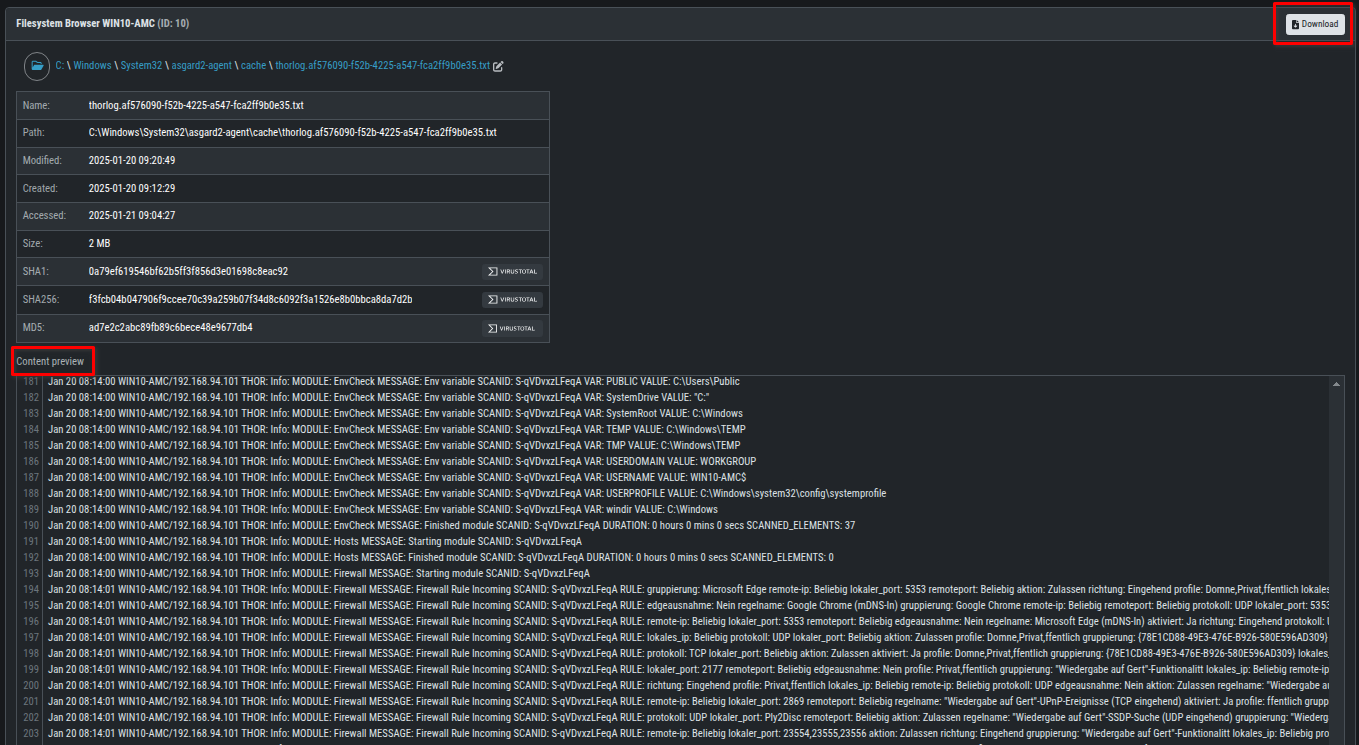
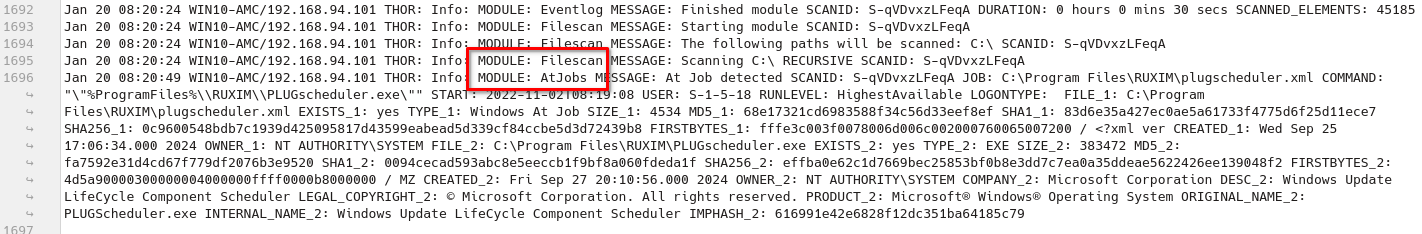
Information we can draw from this log extract
-
THOR has scanned with module "Filescan"and the feature "AtJobs" (AT entries check).
-
The scanned file was "C:\Program Files\RUXIM\plugscheduler.xml"
To verify if this module and feature are causing the scan to fail, we create a scan with the --noatjobs to disable this feature. However, it's generally more effective to analyze the operating system logs before adjusting scan parameters.
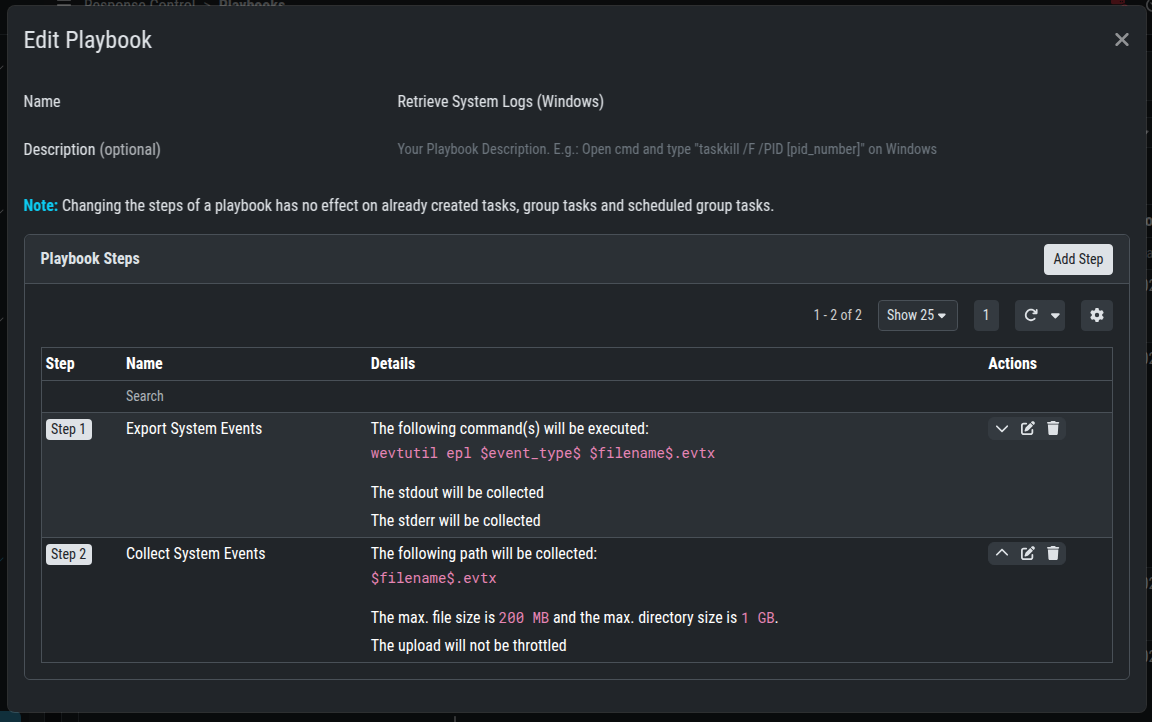
Retrieving Windows Event Logs (Playbook example)
The operating system's event logs aid in analyzing scan termination. These can be retrieved via a playbook.
The example below shows how to use wevutil on MS Windows.